This article shows how to plot multiple graphs in matplotlib.
Contents
- How to plot multiple graphs side by side
- How to plot multiple graphs on top of each other
sponsored link
How to plot multiple graphs side by side
In the beginning, I show how to plot multiple graphs side by side.
Create a figure object to display a graph.
Multiple graphs can be displayed side by side by specifying as subplots.
This is the example code.
import numpy as np
import matplotlib.pyplot as plt


x = np.linspace(0, 10, 1000)

y1 = np.sin(x)
y2 = np.cos(x)


c1, c2 = 'blue', 'green'
l1, l2 = 'sin', 'cos'

xl1, xl2 = 'x', 'x'
yl1, yl2 = 'sin', 'cos'


# Create a figure object
fig = plt.figure(figsize = (10,6), facecolor='lightblue')

# Create subplots
ax1 = fig.add_subplot(2, 1, 1)
ax2 = fig.add_subplot(2, 1, 2)

# Pass data to each subplot
ax1.plot(x, y1, color=c1, label=l1)
ax2.plot(x, y2, color=c2, label=l2)

# Add x-label to each subplot
ax1.set_xlabel(xl1)
ax2.set_xlabel(xl2)

# Add y-label to each subplot
ax1.set_ylabel(yl1)
ax2.set_ylabel(yl2)

# Show legends
ax1.legend(loc = 'upper right')
ax2.legend(loc = 'upper right')

plt.show()
The above code generates the following graph.
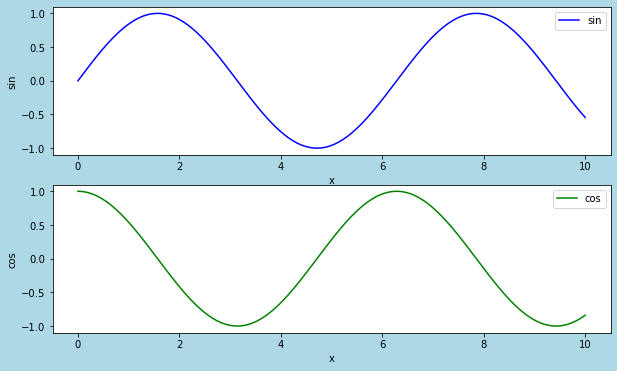
> fig = plt.figure(figsize = (10,6), facecolor='lightblue')
Create a figure object to display a graph.
Specify the width and height with "figsize".
Specify the color with "facecolor".
> ax1.plot(x, y1, color=c1, label=l1)
> ax2.plot(x, y2, color=c2, label=l2)
The data is passed to the subplot.
Specify the color of the plot with "color".
Specify the legend string with "label".
How to plot four graphs side by side
An example of four graphs is also shown below.
This is the example code.
import numpy as np
import matplotlib.pyplot as plt


x = np.linspace(0, 10, 1000)

y1 = np.sin(x)
y2 = np.cos(x)
y3 = -np.sin(x)
y4 = np.sin(x)**2


c1,c2,c3,c4 = 'blue', 'green', 'red', 'black'
l1,l2,l3,l4 = 'sin', 'cos', '-sin', 'sin**2'

xl1, xl2, xl3, xl4 = 'x', 'x', 'x', 'x'
yl1, yl2, yl3, yl4 = 'sin', 'cos', '-sin', 'sin**2'


# Create a figure object
fig = plt.figure(figsize = (10,6), facecolor='lightblue')

# Create subplots
ax1 = fig.add_subplot(2, 2, 1)
ax2 = fig.add_subplot(2, 2, 2)
ax3 = fig.add_subplot(2, 2, 3)
ax4 = fig.add_subplot(2, 2, 4)

# Pass data to each subplot
ax1.plot(x, y1, color=c1, label=l1)
ax2.plot(x, y2, color=c2, label=l2)
ax3.plot(x, y3, color=c3, label=l3)
ax4.plot(x, y4, color=c4, label=l4)

# Add x-label to each subplot
ax1.set_xlabel(xl1)
ax2.set_xlabel(xl2)
ax3.set_xlabel(xl3)
ax4.set_xlabel(xl4)

# Add y-label to each subplot
ax1.set_ylabel(yl1)
ax2.set_ylabel(yl2)
ax3.set_ylabel(yl3)
ax4.set_ylabel(yl4)

# Show legends
ax1.legend(loc = 'upper right')
ax2.legend(loc = 'upper right')
ax3.legend(loc = 'upper right')
ax4.legend(loc = 'upper right')


plt.show()
The above code generates the following graph.
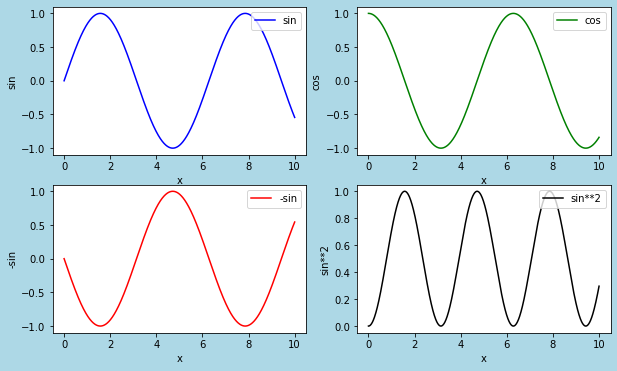
> ax1 = fig.add_subplot(2, 2, 1)
> ax2 = fig.add_subplot(2, 2, 2)
> ax3 = fig.add_subplot(2, 2, 3)
> ax4 = fig.add_subplot(2, 2, 4)
The subplots are added at the 2-row and 2-column position.
sponsored link
How to plot multiple graphs on top of each other
I show how to plot multiple graphs on top of each other.
This is the example code.
import numpy as np
import matplotlib.pyplot as plt


x = np.linspace(0, 10, 1000)

y1 = np.sin(x)
y2 = np.cos(x)


c1, c2 = 'blue', 'green'
l1, l2 = 'sin', 'cos'

xl = 'x'
yl = 'y'


# Create a figure object
fig = plt.figure(figsize = (6,4), facecolor='lightblue')

# Pass data to each subplot
plt.plot(x, y1, color=c1, label=l1)
plt.plot(x, y2, color=c2, label=l2)

# Add labels to each subplot
plt.xlabel(xl1)
plt.ylabel(yl1)

# Show legends
plt.legend(loc = 'upper right')

plt.show()
The above code generates the following graph.
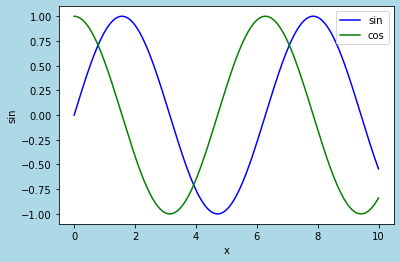
> plt.plot(x, y1, color=c1, label=l1)
> plt.plot(x, y2, color=c2, label=l2)
Data are added to the graph using the plot function.
sponsored link