This article shows list of color names in matplotlib.
Contents
- List of Color Names
- How to Get a List of Colors
- [Supplement]How to Plot a Graph using a Color List
sponsored link
List of Color Names
I show the list of colors available in matplotlib.
Three groups of colors can be specified : Base Colors, Tableau Palettes, and CSS Colors.
Color code can also be used.
I will show each color group in order.
The figures are taken from the official documentation.
Base Colors
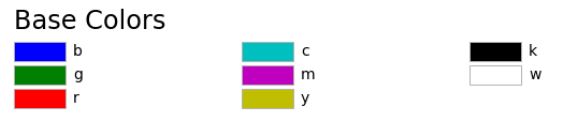
Base Color can be specified by a single letter.
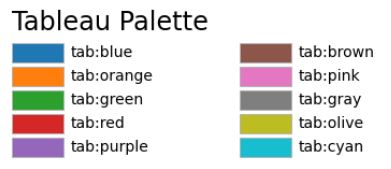
Tableau Palette
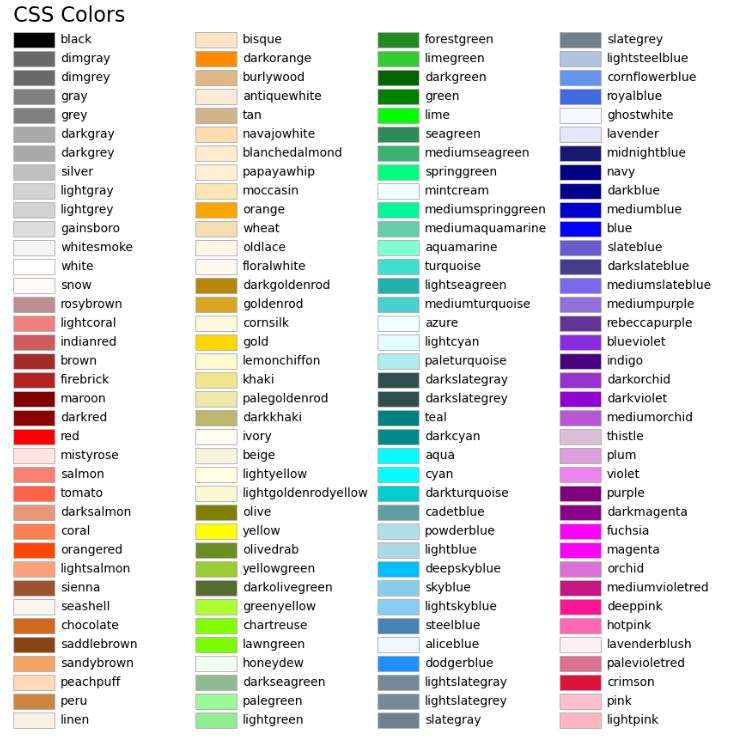
CSS Colors
Color code
The color code is the code used to specify colors on a website.
It is described as a six-digit hexadecimal number.
For example, white is #000000 and black is #FFFFFFF.
sponsored link
How to Get a List of Colors
Next, I show how to get a list of colors.
The following code can be used to get a list of each color group.
- Base Colors : matplotlib.colors.BASE_COLORS
- Tableau Palette : matplotlib.colors.TABLEAU_COLORS
- CSS Colors : matplotlib.colors.CSS4_COLORS
In the following section, I show the example code.
Base Colors
This is the example code to get a list of Base Colors.
import matplotlib.colors as mcolors
import pprint

base_colors = mcolors.BASE_COLORS

pprint.pprint(base_colors)
"""
{'b': (0, 0, 1),
 'c': (0, 0.75, 0.75),
 'g': (0, 0.5, 0),
 'k': (0, 0, 0),
 'm': (0.75, 0, 0.75),
 'r': (1, 0, 0),
 'w': (1, 1, 1),
 'y': (0.75, 0.75, 0)}
"""

pprint.pprint(list(base_colors.keys()))
"""
['b', 'g', 'r', 'c', 'm', 'y', 'k', 'w']
"""
The data is dictionary type.
The "key" is "color name" and the "value" is a "tuple of RGB values".
> pprint.pprint(list(base_colors.keys()))
The list of keys is got using "dictionary".keys( ).
Tableau Palette
This is the example code to get a list of Tableau Palette.
import matplotlib.colors as mcolors
import pprint

tab_colors = mcolors.TABLEAU_COLORS

pprint.pprint(tab_colors)
"""
OrderedDict([('tab:blue', '#1f77b4'),
             ('tab:orange', '#ff7f0e'),
             ('tab:green', '#2ca02c'),
             ('tab:red', '#d62728'),
             ('tab:purple', '#9467bd'),
             ('tab:brown', '#8c564b'),
             ('tab:pink', '#e377c2'),
             ('tab:gray', '#7f7f7f'),
             ('tab:olive', '#bcbd22'),
             ('tab:cyan', '#17becf')])
"""

pprint.pprint(list(tab_colors.keys()))
"""
['tab:blue',
 'tab:orange',
 'tab:green',
 'tab:red',
 'tab:purple',
 'tab:brown',
 'tab:pink',
 'tab:gray',
 'tab:olive',
 'tab:cyan']
"""
CSS Colors
This is the example code to get a list of CSS Colors.
import matplotlib.colors as mcolors
import pprint

css_colors = mcolors.CSS4_COLORS

pprint.pprint(css_colors)
"""
{'aliceblue': '#F0F8FF',
 'antiquewhite': '#FAEBD7',
 'aqua': '#00FFFF',
 'aquamarine': '#7FFFD4',
 'azure': '#F0FFFF',

 …

 'wheat': '#F5DEB3',
 'white': '#FFFFFF',
 'whitesmoke': '#F5F5F5',
 'yellow': '#FFFF00',
 'yellowgreen': '#9ACD32'}
"""

pprint.pprint(list(css_colors.keys()))
"""
['aliceblue',
 'antiquewhite',
 'aqua',
 'aquamarine',
 'azure',

 …

 'wheat',
 'white',
 'whitesmoke',
 'yellow',
 'yellowgreen']
"""
sponsored link
[Supplement]How to Plot a Graph using a Color List
I show how to plot a graph using a color list.
import matplotlib.pyplot as plt
import matplotlib.colors as mcolors
import numpy as np
tab_colors = mcolors.TABLEAU_COLORS
colorlist = list(tab_colors.keys())
x = np.arange(0, len(colorlist))
y = np.repeat(1, len(colorlist))
fig = plt.figure(figsize = (12,3), facecolor='lightblue')
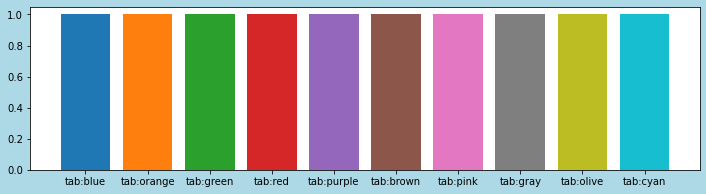
plt.bar(x, y, color=colorlist, tick_label=colorlist, align="center")
plt.show()The above code generates the following graph.
> tab_colors = mcolors.TABLEAU_COLORS
> colorlist = list(tab_colors.keys())
The dictionary type data of Tableau Palette is got and converted to the list.
The following article explains how to create a bar plot.
sponsored link