This article shows how to save a plot using matplotlib.
Contents
◆How to Save a Plot to a File in Matplotlib
- How to Use "savefig" method
- The Example Code to Save a Plot
sponsored link
How to Save a Plot to a File in Matplotlib
I show how to save a plot to a file.
Matplotlib provides "matplotlib.pyplot.savefig" method for saving plot.
First, I will show the use of the "savefig" method.
Then, I will show the example code.
How to Use "savefig" method
I show how to use "savefig" method.
The way to use of "savefig" method is described in matplotlib documentation.

Specify a file path as an argument.
The image formats that can be saved are as follows.
Format
- eps
- jpeg
- jpg
- png
- ps
- raw
- rgba
- svg
- svgz
- tif
- tiff
The Example Code to Save a Plot
I show the example code to save a plot.
import numpy as np
import matplotlib.pyplot as plt
import pathlib
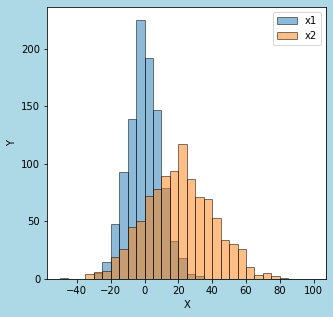
x1 = np.random.normal(0, 10, 1000)
x2 = np.random.normal(20, 20, 1000)
fig = plt.figure(figsize = (5,5), facecolor='lightblue')
plt.xlabel('X')
plt.ylabel('Y')
plt.hist(x1, bins=30, range=(-50, 100), ec='black', alpha = 0.5, label='x1')
plt.hist(x2, bins=30, range=(-50, 100), ec='black', alpha = 0.5, label='x2')
plt.legend()
plt.show()
path_dir = pathlib.Path(r'test')
path_img = path_dir.joinpath('img.png')
fig.savefig(path_img)The above code generates the following graph.
> x1 = np.random.normal(0, 10, 1000)
> x2 = np.random.normal(20, 20, 1000)
Random numbers are generated according to a normal distribution.
> fig = plt.figure(figsize = (5,5), facecolor='lightblue')
The figure object is generated.
> plt.xlabel('X')
> plt.xlabel('Y')
Labels are added.
> plt.hist(x1, bins=30, range=(-50, 100), ec='black', alpha = 0.5, label='x1')
> plt.hist(x2, bins=30, range=(-50, 100), ec='black', alpha = 0.5, label='x2')
Specify data in list type as an argument to plot histograms.
> plt.legend()
Legend is added.
> path_dir = pathlib.Path(r'test')
> path_img = path_dir.joinpath('img.png')
The path object is generated by using "pathlib" module.
> fig.savefig(path_img)
The plot is saved as a image file by using "savefig" method.
sponsored link